They also know how messy it can all get – masses of data, 100s of one-off reports, whole excel files of different indicators.
This was certainly the case for NordPass, says Ina Bielskė, the scale-up’s CRO. “Like other companies, we have lots of data and indicators. And we know how much value they hold. But it ended up with us having so many different one-off reports in marketing and sales that we couldn’t make sense of it.”
But according to Ina, you can find a way out of this forest of statistics with the right framework. “We decided we needed to get some clarity on this topic. We found a framework that felt logical and was adaptable to our various needs – the North Star Metric framework.”
Ina took some time to share her insights with us on how NordPass has used this powerful framework to make sense of its treasure trove of data and align its Sales and Marketing teams.
The North Star Metric Framework
Originating in Silicon Valley, the North Star Metric emerged as an alternative to so-called “vanity metrics” – data points that look good but have no real impact on your business goals.
The likes of Airbnb, Netflix and Spotify have used this framework to achieve huge market shares and offer ever-improving customer experience. Here’s a quick Q & A with Ina on the basics of the North Star Metric.
What is a North Star Metric?
“It’s an essential goal and an indicator of success. It has to be clear, measurable and easy to communicate. It must be fundamental to achieving the goals of your business and it must be long-term – you want to keep the same North Star Metric for at least one year, preferably longer.”
How do you create a North Star Metric?
“For metrics related to B2B marketing, you have to get your Sales and Marketing teams working together. They have to collaborate to create a common goal that benefits the whole business. Start by considering what is key to your business’ success and development, and identify a metric that will measure this factor.”
Can you share some good examples of North Star Metrics?
“Typical marketing and financial indicators that could serve as your North Star Metric include:
B2B Sales revenue per year,
Return on Ad Spend (ROAS),
% share of the market,
Ratio of Customer Lifetime Value to Customer Acquisition Cost (LTV / CAC),
The “Rule of 40” – where your combined revenue growth rate and profit margin equals or exceeds 40%,
Or contract renewal rate.“
How many North Star Metrics can we have?
“For larger companies, it is not possible to have only one goal – you should aim for one North Star Metric for key areas like customer attraction, retention and profitability. Just remember not to have too many, and to keep them consistent for long periods of time.”
Reaching your North Star
There is an obvious challenge with North Star Metrics – the time lag. “Have you ever tried to accurately forecast the current month’s sales results on the 1st day of the month?” asks Ina.
This is especially problematic in B2B. “Purchase decisions can take a whole quarter, even a whole year. What if your approach is wrong? You may only find out when it’s too late to do something about it.”
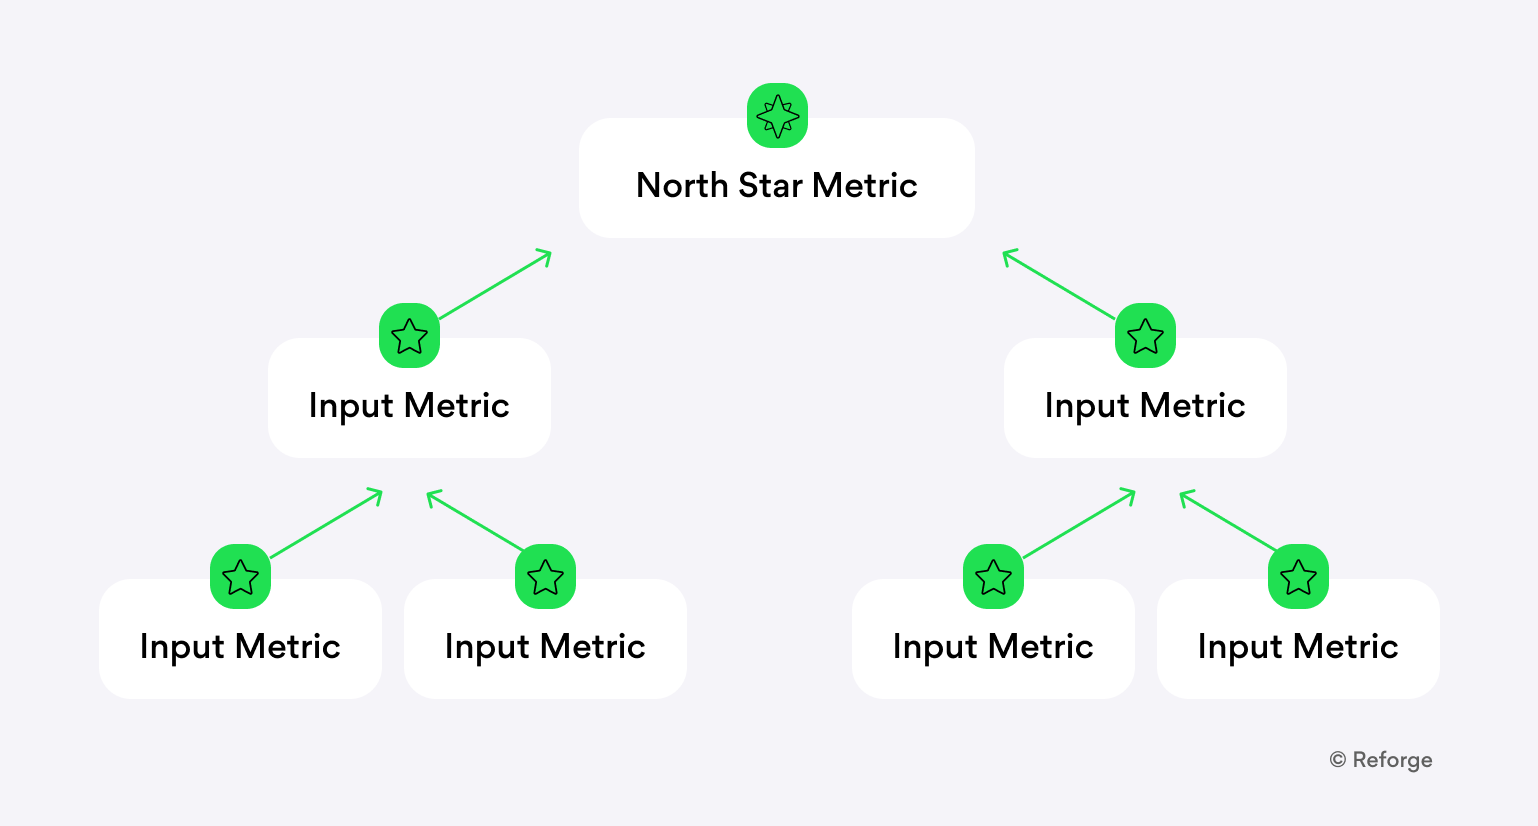
Input indicators that guide the way
The solution to this challenge is input indicators. “These are additional indicators that measure the progress being made towards your overall North Star Metric,” Ina explains.
“Imagine you have chosen revenue as your North Star Metric. Your input indicators could be things like:
The number of potential leads you have,
The % of these leads you successfully convert into sale,
Total revenue potential in your sales funnel,
Quality traffic to your website,
The conversion rate on your website (completing a contact form),
Or the average cost per lead (CPL).”
Choosing the right input indicators
“If you pick the wrong input indicators you’ll have big problems,” Ina comments. “Your team will work hard to deliver them, but you won’t get the end results you hoped for.”
So, what makes an effective input indicator? “Well, you should be able to measure it frequently – daily or weekly. Most importantly, it needs to have a tangible impact on your North Star Metric,” says Ina.
A case study: missing a North Star Metric with the wrong input indicators
Ina and her team are now adept at finding the right Input indicators, but – like best of us – they have learned through mistakes. Here she presents a quick case study of how the team missed a North Star Metric by focusing on the wrong input indicators. This case study is based on a real example, just with the numbers changed.
“We had a North Star Metric of achieving a specific level B2B revenue in January – let’s say it was $1 million,” Ina recalls. “To track that we were on target, we set up the input indicator of driving 2,000 customers to a 14-day free trial we were running.”
What was the result?
“We actually outperformed our input indicator and achieved 3,000 completed free trial forms. However, total revenue in January was not even close to our target. Why? 1,000 of the registrations were fake leads, and from the real leads, 500 never actually used their free trial. 500 more did buy the product, but only in February.”
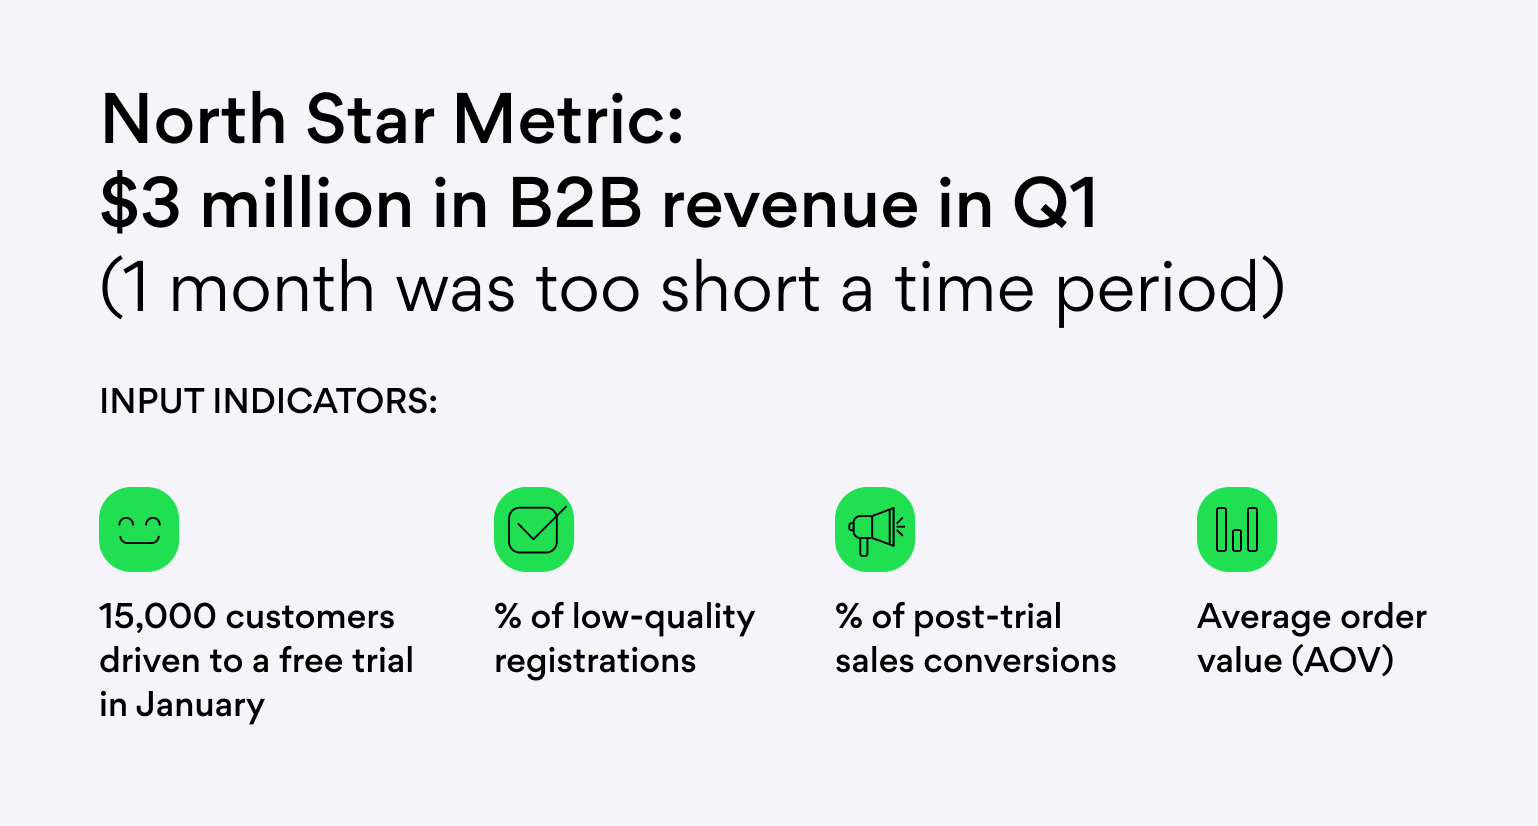
“So our input indicator of free trial sign ups wasn’t a good predictor of monthly revenue. And we had overlooked other key input indicators like average order value, which in that month was too low to achieve the revenue level we were targeting.”
“Since then, we have learned our lessons. Here are the input indicators I would use if I had another chance.”
Aligning your team around input indicators and North Star Metrics
“Once you have your North Star Metric and the right input indicators, your team’s day-to-day work will now be aligned,” says Ina.
“If one of these input indicators is off, you understand that you are unlikely to meet your North Star Metric. For example, let’s say you realize there are not enough leads in your funnel. Now your team can take immediate action to add leads in order to make sure your North Star is achieved.”
You may not instantly hit upon the right North Star Metrics and input indicators. But according to Ina, the results make it all worthwhile. “When you get it right, you will be able to make better sense of your valuable data. You will also save time, increase efficiency, and boost morale as the efforts you put in have a tangible impact on your business’ success.”